
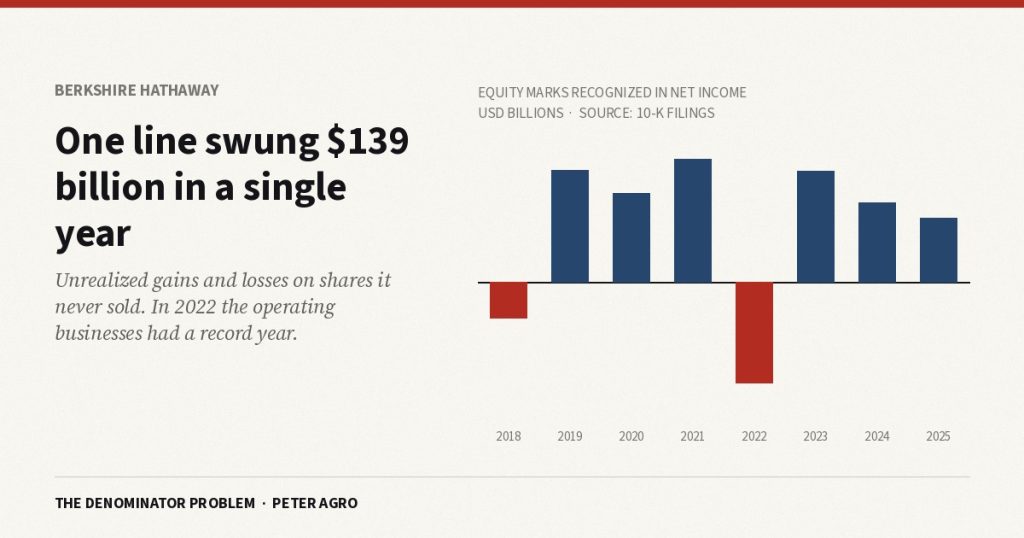
In 2022 Berkshire Hathaway reported a loss.
Its insurance businesses, its railroad, its energy operations and its manufacturers had one of the best years in the company’s history. Operating earnings set a record. And the headline number, the one that appears on brokerage screens and in earnings coverage, was negative.
Nothing improper happened. The number was audited and correct. What produced it was a single line: a $63 billion decline in the market value of stocks Berkshire owned and did not sell.
The year before, the same line ran the other way. A $76 billion gain, recorded as profit, on shares that were never traded. Between 2021 and 2022 that one item swung by roughly $139 billion, and it had nothing to do with how any of the underlying businesses performed.
What changed
Before 2018, unrealized gains and losses on corporate stock holdings were recorded on the balance sheet and kept out of the income statement until the shares were actually sold. The separation was useful. The income statement described what a business did. The balance sheet described what it owned.
An accounting standard that took effect for fiscal years beginning after December 2017 ended that separation for equity securities. Changes in market value now run straight through net income, sold or not, cash or not.
Warren Buffett has objected to this in every Berkshire annual letter since. His complaint is not that the accounting is wrong but that the resulting figure is useless for judging the company, because the portfolio can move by tens of billions in a quarter for reasons unconnected to any of the operating businesses. He tells shareholders in writing, every year, to disregard the bottom line and read operating earnings instead.
Those letters are read by millions. The price-to-earnings ratio displayed on every brokerage platform is still calculated from the number he told everyone to ignore.
What I expected to find
I set out to measure how much this distorts corporate earnings generally, on the assumption that it would turn out to be widespread — that a great many companies were reporting investment gains as profit and that the market was systematically misreading the result.
The Securities and Exchange Commission publishes every tagged figure from every corporate filing, free, to anyone who asks. I pulled the relevant disclosure from the seven hundred largest filers, then opened fifteen of the largest results and checked them line by line against the original documents.
The total across eight years, 2018 through 2025, is roughly $315 billion.
Berkshire Hathaway is 86.7% of it.
Add four more insurers and you have 91%. The remaining ninety-nine companies — which include every large technology firm in the sample — account for 9%. Alphabet contributes about $10.6 billion across the whole eight years. Amazon and eBay are net negative.
That was not the answer I was looking for, and it is a better one. The standard did not scatter a distortion across corporate America. It changed how a small number of insurance companies report a portfolio they have always held, for a straightforward reason: insurers collect premiums now and pay claims later, and they invest the difference. Holding securities is the business.
The part worth watching
There is a second finding, and it is the one that may matter to a portfolio.
The technology companies were not absent from this because it does not apply to them. They were absent because it had barely started. Western Digital reported no equity marks at all through 2025, then $6.5 billion in its 2026 fiscal year, after retaining a 19.9% stake in a business it spun off — a fraction deliberately below the threshold that would have required it to absorb that company’s losses instead of recording its appreciation. Microsoft’s single 2026 figure exceeds its previous eight years combined. Alphabet’s second quarter of 2026 alone was roughly double its entire eight-year total.
Those are recent, they are quarterly, and the annual filings that confirm or contradict them arrive in early 2027. What can be said now is that something changed in 2026, at exactly the companies holding stakes in private artificial intelligence businesses, and that the private stakes are valued by estimate rather than by any market price.
What it means for a portfolio
Three practical things, none requiring an accounting background.
A price-to-earnings ratio is only as good as the earnings underneath it. When a company holds a large securities portfolio, the reported figure includes changes in the value of things it did not sell. In a rising market that makes the company look cheaper than the business justifies. In a falling one it can produce a loss where the operations had a record year.
The distortion runs both ways. This is not a story about companies flattering themselves. Berkshire’s reported earnings understated its operating performance badly in 2018 and again in 2022, and overstated it in 2019, 2021 and 2023.
A multiple is a statement about required growth. Convert it and the decision becomes concrete. At seventeen times earnings, a company must grow profits by roughly eight percent a year to deliver ten percent annually over a decade. At thirty-one times, it needs about fifteen percent, sustained. Eight percent is ordinary. Fifteen percent for ten years is rare. Which question you are answering depends entirely on which earnings figure you started from.
The question to ask
If you have a wealth manager, one question at your next review surfaces all of this.
Ask what share of the reported earnings behind your largest holdings came from operations, and what share came from revaluing assets the company has not sold.
A good adviser will know or will find out. The answer takes about twenty minutes per company using documents that cost nothing. What you should not accept is the ratio from the screen, offered as though the number were a fact about the business rather than one construction of it, assembled under conventions that changed in 2018.
One last thing, from the checking. Of fifteen companies I verified against their own filings, six had restated a figure after first publishing it. One had reported three periods with the sign backwards — a gain that was actually a loss — and corrected it later without announcement. The data is public, it is free, and it is not always right the first time.
That is not a reason to distrust the filings. It is a reason to open them.
Peter Agro writes on markets and accounting. He is the author of The Denominator Problem: What Corporate Earnings Stopped Measuring, and How to Read Them Now. The research method and the underlying data are published without charge at peteragro.com.
This article is educational and is not investment advice. Figures are drawn from SEC filings and are current as of writing. Verify against current filings before relying on them.
Author

Written by
Recent Posts

AI for personal finance: where PennyGuard fits

How to Pick a Homecoming Dress for Your Body Type (and Feel Amazing in It)

World Cup Injury Attorney for Vancouver Events
What a 3-Carat Engagement Ring Actually Costs in 2026: The Real Numbers
The Skincare Habits That Make a Real Difference Over Time
Categories
- Art
- Articles
- Business of Luxury
- Celebrities
- Culture
- Entertainment
- Events
- Faces of Summer 2026
- Fashion
- Fashion & Style
- Featured
- Finance
- Food, Spirits, Wine
- Hamptons
- Hamptons Celebrities
- Health
- Health & Beauty
- Lifestyle
- Luxury Lifestyle
- Press
- Profiles
- Real Estate
- Technology
- The Chronicles
- Travel
- Uncategorized
- Weddings